Know the risk you're actually taking.
Most tools tell you what you own. JEGACAP tells you what it means for your risk: how concentrated you really are, how much your holdings move together, and whether you're being paid for carrying it. Analytics, not stock tips.
Free to start·Pro A$5/mo·Advanced A$9/mo
A demo portfolio, run through the engine every account uses. How each number is calculated.
Three ways to see your portfolio clearly.
Understand your risk
Volatility, drawdowns, correlation and downside exposure, measured from your actual holdings and explained in plain English.
Find hidden concentration
Effective holdings, top-position weight and highly correlated pairs, so concentration you never intended stops hiding.
Compare portfolio structures
Weigh an alternative allocation against your real one — return, volatility, Sharpe, concentration — before you change a thing.
See what your portfolio is really doing.
Six documented components, each mapped from a real statistic to a 0-100 scale by a published formula. No black box, no LLM guessing at a number. See the exact methodology.
Historical observation from the analysed period, not a forecast. See the disclaimer.
Start free. Pay when it earns it.
Real analytics on the free tier, not a crippled trial. Cancel or switch anytime.
Free
Holdings, CSV import, portfolio summary, Health Score and the full ASX universe.
Create free accountPro
Plus full statistics, the optimizer, backtesting, stress testing and saved portfolios.
Start with ProAdvanced
Plus leverage & LVR, correlation stress testing and Portfolio Lab.
Start with AdvancedHow it works.
Build your portfolio
Enter holdings or import a CommSec export. Or open the demo portfolio first.
Analyse your risk
Diversification, concentration, correlation, volatility and your Health Score.
Compare allocations
Put a proposed allocation next to your current one and see what changes.
One statistical methodology, applied end to end.
No stock-picking narrative, no black box. Every number comes from a documented, testable calculation with a worked example.
~2,339 ASX instruments, real sectors
Tagged against actual GICS sectors from exchange data, not generic buckets.
Formulas, not folklore
Returns, covariance, shrinkage, Sharpe, optimization, backtesting and the Health Score — each written out as an equation with a worked example.
Open source, MIT licensed
Read the engine that produces your numbers. The whole platform is public on GitHub under the MIT licence.
See it in action.
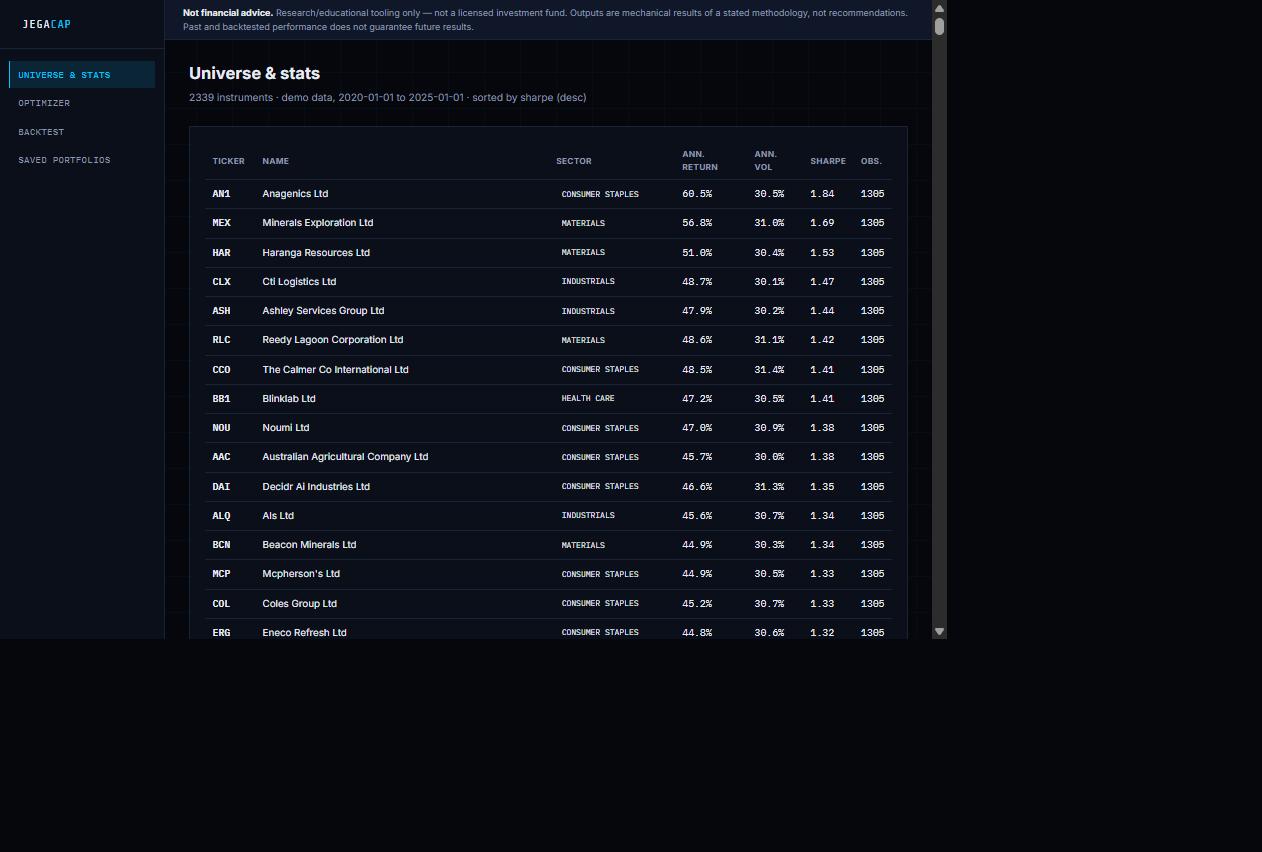
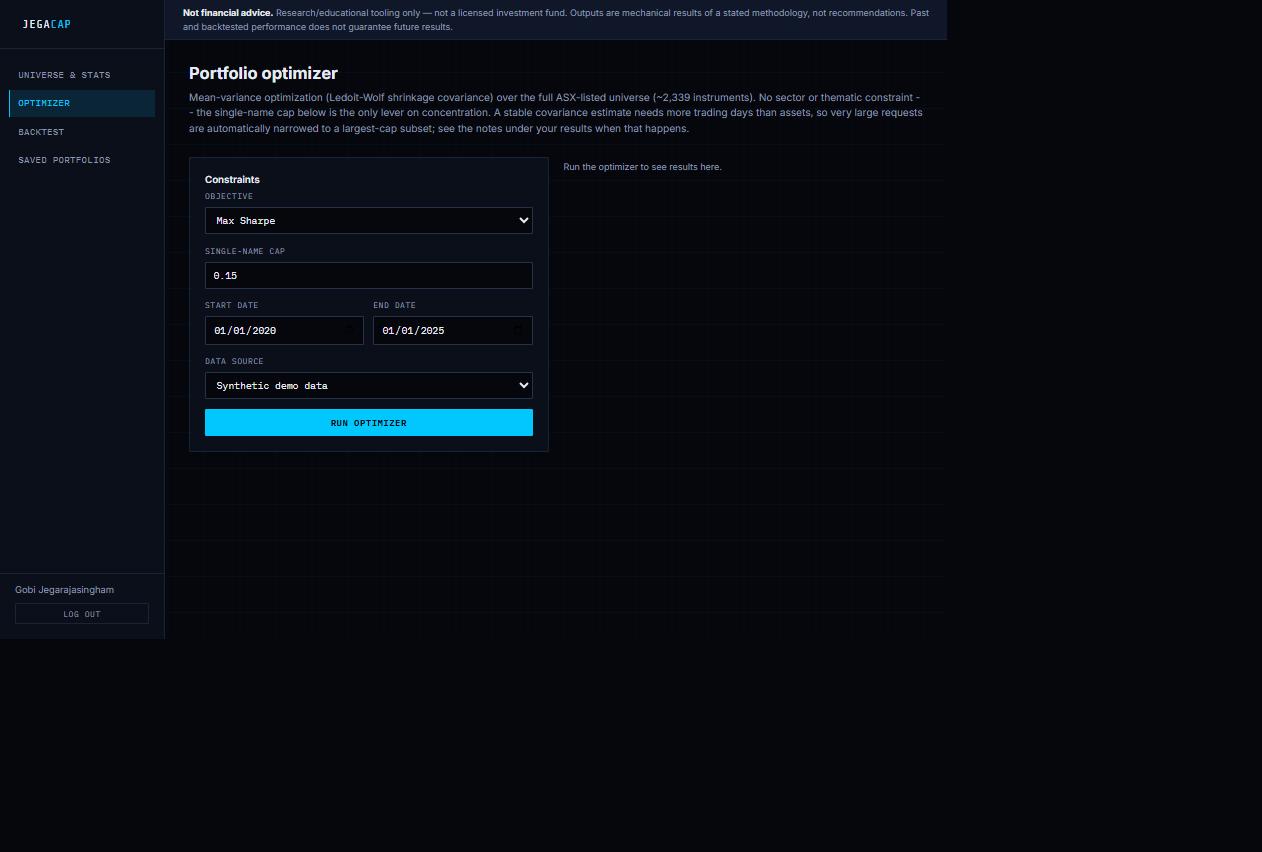
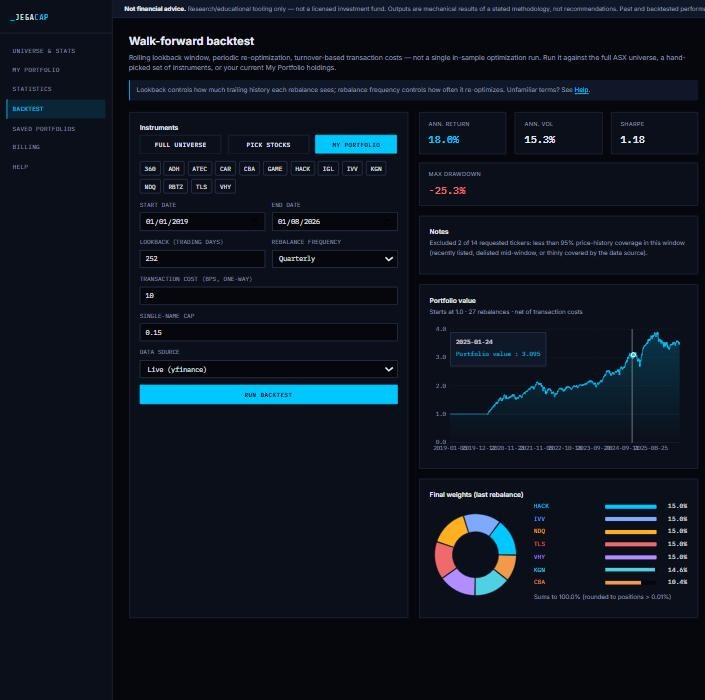
Real screens, not mockups.
How we hold ourselves to it.
Documented, not hand-wavy
Every statistic is on the methodology page with its formula and a worked example. Nothing is asserted without showing the math.
Open source, not just open about it
The whole platform is public and MIT licensed. Read exactly what runs on your holdings, or fork it.
Honest about the stage
Early-stage and self-funded through subscriptions. We say so rather than dressing up a beta as a finished product.
Understand your portfolio before taking more risk.
Free to start, with Pro and Advanced from A$5/month. The status page lists exactly what's proven today versus still being built.